
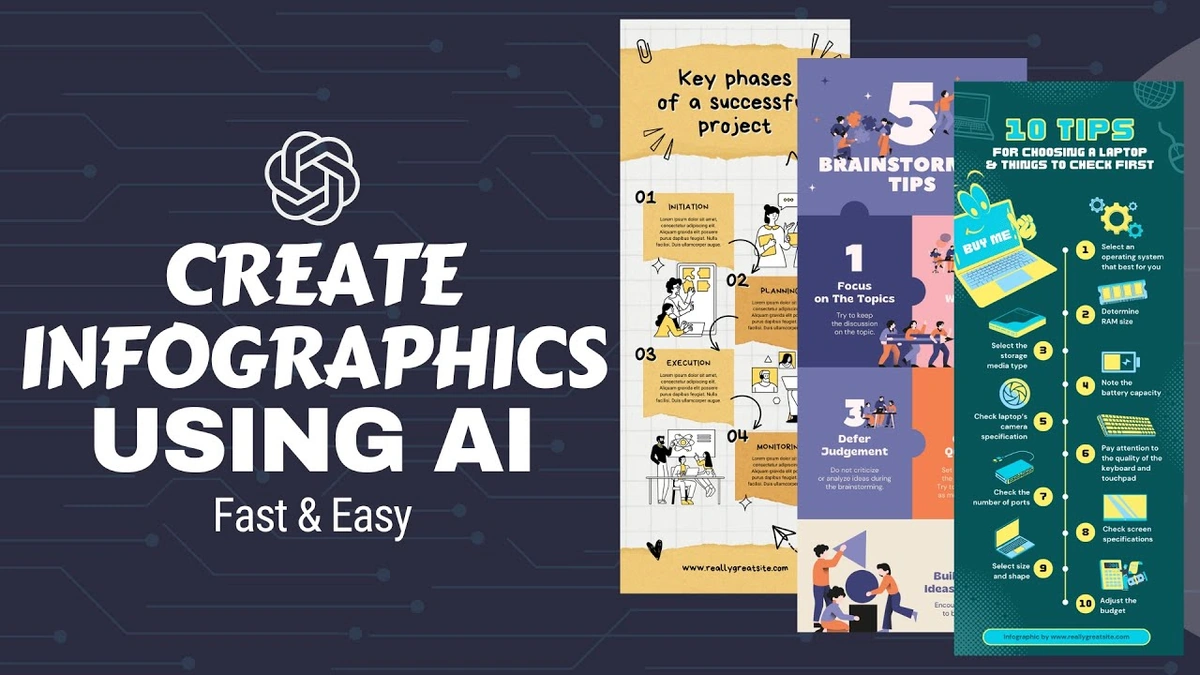
Are you tired of spending hours designing visual graphics from scratch? Turning raw numbers and long text into clear visuals can feel exhausting without graphic design experience.
Fortunately, modern artificial intelligence has changed how creators turn data into graphics. The best ai tools for infographics allow anyone to generate clean, high-impact visuals in minutes by converting text prompts or raw documents into polished layouts. Leading options include Canva Magic Studio, Piktochart AI, Venngage AI, and Canvora. Whether you need an ai infographic maker free plan or an enterprise visual generator, using ai for visual content speeds up production while keeping your design quality high.
Why You Should Use AI for Infographic Design
Creating visual content used to require complex software like Adobe Illustrator or expensive freelance designers. Today, an infographic generator ai platform can analyze text, pick relevant icons, build charts, and align color schemes automatically. This shift is part of a broader trend where AI is transforming how creators approach visual design overall.
Here are the main advantages of adopting AI design software:
-
Speed and Efficiency: Turn a 2,000-word article into a visual summary within two minutes.
-
Cost Savings: Reduce your reliance on full graphic design teams for routine visual assets.
-
Data Accuracy: Connect your spreadsheets directly to an ai data visualization tool to turn rows of numbers into charts.
-
Brand Consistency: Store custom brand kits so every generated graphic matches your official colors, fonts, and logos.
What Makes a Great AI Infographic Generator?
Not all visual generators perform at the same level. When testing tools for content marketing, business reports, or classroom lessons, keep these four criteria in mind:
1. Source Reading and Summarization
Some tools require you to write perfect prompts. The strongest software reads full documents, PDF reports, or blog URLs directly and pulls out the key metrics for you.
2. Customization and Control
AI should build the initial structure, but you need full editing control. Look for drag-and-drop editors that let you tweak text, swap icons, and adjust spacing easily.
3. Chart Variety
A good ai data visualization tool must support multiple chart types, including pie charts, bar graphs, process flowcharts, and timelines.
4. Export Formats and Licensing
Ensure the platform offers high-resolution downloads like PNG, PDF, or vector SVG formats. Check licensing policies to confirm that generated graphics are cleared for commercial use.
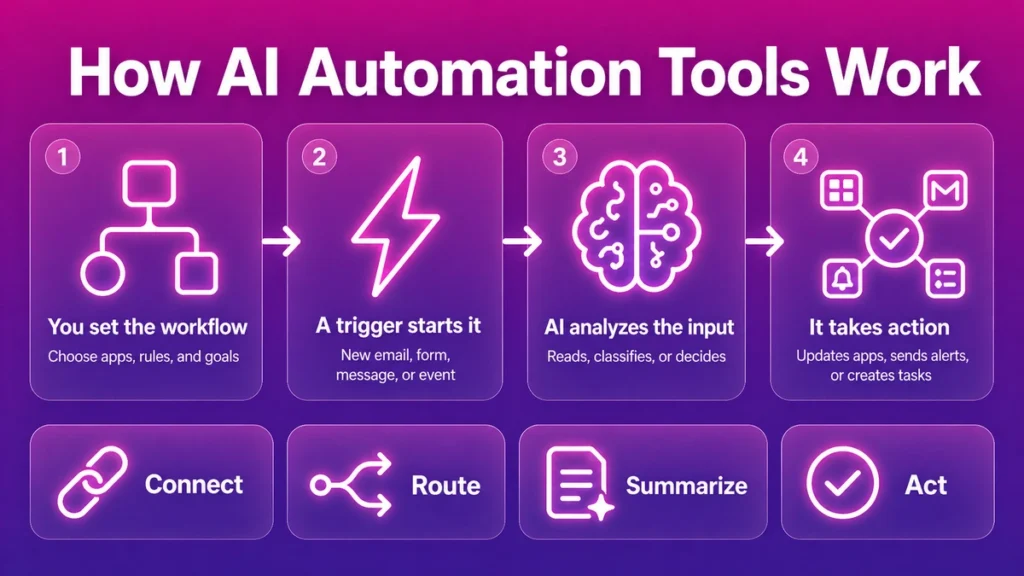
Top 6 AI Tools for Creating Infographics
Here is an in-depth breakdown of the top tools based on features, design flexibility, and overall value.
1. Canva Magic Studio (Best Overall for Ease of Use)
Canva remains one of the most popular design platforms globally. Its integrated AI suite, Magic Studio, lets you type a description like “quarterly sales summary with bar charts” to generate complete visual layouts instantly. If you’re deciding between Canva and other Adobe-powered design tools, it’s worth comparing them head-to-head first.
Key Features
-
Magic Design for Graphics: Generates visual layouts from simple text prompts.
-
Vast Template Library: Access over 250,000 pre-made visual templates across dozens of industries.
-
Brand Kit Integration: Apply your company colors, typography, and logo with a single click.
-
Live Collaboration: Work together with team members in real time directly inside your browser.
Pros and Cons
-
Pros: Extremely beginner-friendly, huge asset library, smooth web interface.
-
Cons: Free tier exports contain watermarks on select elements; complex data charts are somewhat limited.
Pricing
-
Free Plan: Basic template access and limited AI credits.
-
Pro Plan: Estimated at $12.99 per month for full template access and background removal.
2. Piktochart AI (Best for Reports and Educational Content)
Piktochart has long been a favorite for HR managers, educators, and researchers. Its dedicated AI layer allows users to paste raw notes or campaign briefs to produce clean, report-style graphics.
Key Features
-
Text-to-Graphic Generation: Converts outlines, notes, or prompts into structured visual flows.
-
Interactive Charting: Easily upload CSV or Google Sheets files to build live graphs.
-
Modular Blocks: Reorder content sections effortlessly using stacked block layouts.
-
Multi-Format Export: Download high-resolution PNG, PDF, or presentation formats.
Pros and Cons
-
Pros: Highly structured layouts, excellent for data-dense presentations, strong chart editor.
-
Cons: The AI relies on clear inputs and may require manual tweaking for very long articles.
Pricing
-
Free Plan: Includes 60 AI generation credits per month.
-
Pro Plan: Estimated at $14 per month billed annually.
3. Venngage AI (Best for Business and Data Storytelling)
Venngage specializes in business communication assets. If you need statistical timelines, process flowcharts, or compliance summaries, Venngage AI offers robust structural control.
Key Features
-
Automated Layout Drafts: Converts text prompts into customized diagrams and process maps.
-
Accessible Design Tools: Built-in accessibility checks ensure high color contrast and readability.
-
Commercial License Clearing: According to company guidelines, generated graphics are cleared for commercial use.
-
Smart Diagramming: Automatically resizes shapes and aligns text boxes as you add new points.
Pros and Cons
-
Pros: Outstanding timeline and process templates, strong focus on corporate branding.
-
Cons: Free plan limits downloads, requiring a paid subscription for high-res exports.
Pricing
-
Free Plan: Allows 5 AI generation runs per day with basic editing features.
-
Premium Plan: Estimated at $10 per month per user.
4. Canvora (Best for High-Volume and Automated Social Visuals)
Canvora represents a newer wave of automated platforms built specifically for multi-platform distribution. Instead of starting with a single template canvas, Canvora ingests long text or URL links and outputs multiple platform-ready assets at once.
Key Features
-
Url-to-Visual Generation: Paste a website link to extract key takeaways into visual cards automatically.
-
Multi-Format Batch Output: Generates Instagram carousels, LinkedIn stat cards, and Pinterest graphics in one run.
-
Native Multilingual Support: Generates content in over 150 languages natively without relying on post-translation.
-
Zero Template Setup: Bypasses manual template picking by building custom layouts dynamically.
Pros and Cons
-
Pros: Fastest choice for high-volume content creators, excellent multi-language handling.
-
Cons: Less manual design control compared to canvas-based editors like Canva or Visme.
Pricing
-
Free Plan: Basic starter access with export limits.
-
Starter / Pro Plans: Estimated between $19 and $49 per month based on visual volume.
5. Visme (Best for Data-Rich and Interactive Graphics)
Visme is a powerhouse visual platform designed for teams that need interactive charts, animated figures, and corporate presentation decks.
Key Features
-
Advanced Visual Analytics: Import live data from third-party applications to keep charts updated.
-
AI Layout Assistant: Recommends optimal chart styles based on the type of data you enter.
-
Interactive Elements: Add clickable links, pop-ups, and hover effects for web embeds.
-
3D Graphics Library: Access realistic 3D illustrations and customizable visual elements.
Pros and Cons
-
Pros: Enterprise-grade output, unmatched interactive capabilities, excellent charting options.
-
Cons: Steeper learning curve for absolute beginners compared to simpler tools.
Pricing
-
Free Plan: Basic features with limited storage.
-
Starter Plan: Estimated at $12.25 per month.
6. Adobe Express (Best for High Visual Quality and Brand Consistency)
Powered by Adobe Firefly models, Adobe Express combines generative artwork with clean visual templates, making it a reliable pick for creative teams.
Key Features
-
Firefly Generative AI: Create unique vector illustrations and background textures from text prompts.
-
One-Click Resizing: Instantly adapt graphics for social media formats, print posters, or web banners.
-
Adobe Creative Cloud Sync: Import assets seamlessly from Photoshop and Illustrator.
-
Quick Action Tools: Remove image backgrounds and crop visual elements in seconds.
Pros and Cons
-
Pros: Professional Adobe design output, generous free tier, seamless integration with Adobe tools.
-
Cons: Less specialized for multi-page data reports compared to Venngage or Piktochart.
Pricing
-
Free Plan: Generous template access and basic AI generation features.
-
Premium Plan: Estimated at $9.99 per month.

Comparison of Top AI Infographic Generators
To help you decide which ai tools for infographics fit your workflow best, here is a breakdown of features, ideal use cases, and starting price points.
| Tool Name | Key Strength | Ideal Use Case | Pricing Tier |
| Canva Magic Studio | Overall ease of use and massive template library | Marketers, small businesses, social media managers | Free plan available (Pro from $12.99/mo) |
| Piktochart AI | Structured document and report summarization | HR teams, educators, researchers | Free plan available (Pro from $14.00/mo) |
| Venngage AI | Business diagrams, timelines, and process flows | Corporate communications, data analysts | Free plan available (Premium from $10.00/mo) |
| Canvora | Multi-format batch generation from web URLs | Content marketing agencies, social managers | Free plan available (Paid from $19.00/mo) |
| Visme | Interactive charts and advanced data connections | Enterprise teams, data-driven storytellers | Free plan available (Starter from $12.25/mo) |
| Adobe Express | High-quality graphics powered by Adobe Firefly | Creative teams, brand managers | Free plan available (Premium from $9.99/mo) |
Best Practices for Generating Great AI Infographics
While an infographic generator ai can save you hours of work, human oversight remains crucial for maintaining accuracy and narrative flow.
Follow these proven steps to achieve the best results:
-
Clean Your Data First: Organize your statistical numbers in a clear bulleted list or spreadsheet before uploading them to an ai data visualization tool.
-
Focus on One Core Message: Avoid cluttering your design. A strong graphic communicates one central concept or dataset clearly.
-
Double-Check Statistical Facts: AI tools can misinterpret raw figures. Always verify that bar graphs, percentages, and labels match your source facts precisely.
-
Maintain Visual Contrast: Select strong contrast between text fonts and background colors to ensure high readability on mobile devices.
-
Customize Pre-Made Icons: Replace generic stock icons with graphics that reflect your exact niche or topic.
Conclusion
Finding the right ai tools for infographics depends on your team’s specific goals. If you need fast, versatile designs for social media, Canva Magic Studio and Adobe Express lead the way. If your work focuses heavily on structured business reports, timelines, or complex dataset visuals, tools like Piktochart AI, Venngage AI, and Visme provide the deepest control. Finally, if you need to convert blog posts into visual sets rapidly, Canvora offers incredible speed.
Leveraging ai for visual content enables marketers, educators, and creators to turn dense information into engaging graphics effortlessly. For more insights, software reviews, and guides on cutting-edge visual tools, visit openaihit to stay updated on the latest AI innovations.
Frequently Asked Questions
What is the best ai infographic maker free of charge?
Canva Magic Studio, Piktochart AI, and Adobe Express offer the most functional free tiers. They allow you to test text-to-graphic generation features without paying upfront, though high-resolution exports may require a subscription.
Can AI generate infographics directly from raw data?
Yes, tools like Visme, Venngage, and Piktochart can parse structured text, CSV files, or Google Sheets to automatically generate matching charts, bar graphs, and timelines.
Are AI-generated graphics safe for commercial business use?
Most major platforms clear generated visual assets for commercial use. However, you must ensure that any third-party imagery or logos added during editing do not infringe on existing trademarks.
Do I need prior graphic design skills to use an AI visual tool?
No prior design experience is required. Modern tools handle layout distribution, typography pairing, and color selection automatically, allowing anyone to produce professional visuals using simple text prompts.